Since March 1, 2017 ISONIC 2006 is phased out; the full support of the existing instruments is continued.
ISONIC 2006 is successed by the ISONIC3505
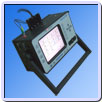
ISONIC 2006 uniquely combines functionality and mobility of the high performance portable digital ultrasonic flaw detector with recording,
imaging, and data processing capabilities of smart computerized inspection system
ISONIC 2006 allows resolving of a variety of ultrasonic inspection tasks:
A-Scan-based inspection using conventional pulse echo, back echo attenuation, and through transmission techniques
Line Scanning and Recording:
Thickness Profile B-Scan imaging and recording is performed through continuous capturing of wall thickness readings along probe trace
B-Scan cross-sectional imaging and recording of defects for longitudinal and shear wave inspection is performed through continuous measuring of echo amplitudes and reflectors coordinates along probe trace
CB-Scan horizontal plane-view imaging and recording of defects for shear, surface, and guided wave inspection is performed through continuous measuring of echo amplitudes and reflectors coordinates along probe trace
TOFD Inspection ñ RF B-Scan and D-Scan Imaging
For the Line Scanning and Recording there are 2 ways of probe position encoding supported:
Corrosion (thickness) mapping is performed through continuous capturing of the wall thickness readings along the probe trace
Flaw Detection ñ Pulse Echo 3D imaging (C-Scan, B-Scan, D-Scan, P-Scan) and recording of defects for the longitudinal and shear wave inspection is performed through continuous measuring of the echo amplitudes and reflectors coordinates along the probe trace with the probe swiveling angle dependency where applicable
Flaw Detection ñ Through Transmission / Back Echo Attenuation 2D imaging and recording (C-Scan) is performed through continuous measuring of the signal amplitudes along the probe trace
CB-Scan horizontal plane-view imaging and recording of defects for the shear, surface, and guided wave inspection is performed through continuous measuring of the echo amplitudes and reflectors coordinates along the probe trace along the probe trace with the probe swiveling angle dependency where applicable
For the XY-Scanning recording ISONIC 2006 is equipped with the built-in airborne ultrasound encoder controller and the interface to the airborne ultrasound sensors. TOFD Inspection may be performed with the use of airborne ultrasound encoding as well.
The optional USB interface to the multi-axis mechanical encoder and the corresponding inspection software packages are available
For all types of the Line Scanning and XY-Scanning inspections the A-Scans are recorded for each probe position along the probe trace and may be played back and evaluated off-line at postprocessing stage.
This unique feature makes it possible off-line defect characterization through echo-dynamic pattern analysis
Thickness Profile B-Scan Data recorded during Straight Line Scanning and Corrosion (thickness) Map data recorded during XY-Scanning is presented in the format compatible with various Risk Based Inspection and Maintenance procedures
ISONIC 2006 is a new generation successor of the very well known ISONIC 2001 model, which became World leading
multitask portable ultrasonic testing and imaging equipment within past years
(2000 thgough 2006) and received Frost & Sullivan Award for Product Differentiation Innovation in 2004.
Comparing to its predecessor ISONIC 2006 has significantly improved portability and weight, battery life,
ultrasonic performance, data processing speed, and human interface
ISONIC 2006 has practically unlimited capacity for storing of:
Single A-Scans accompanied with corresponding instrument settings
Ultrasonic signal spectrum graphs (FFT) accompanied with corresponding RF A-Scans and instrument settings
Various A-Scans sequence records along with corresponding Thickness Profiles, B-Scans, CB-Scans, C-Scans, D-Scans, P-Scans, or TOFD Maps depending on mode of operation selected; each record is accompanied with corresponding instrument settings
ISONIC 2006 complies with requirements of National and International Codes:
ASME Section I ñ Rules for Construction of Power Boilers
ASME Section VIII, Division 1 ñ Rules for Construction of Pressure Vessels
ASME Section VIII, Division 2 ñ Rules for Construction of Pressure Vessels. Alternative Rules
ASME Section VIII Article KE-3 ñ Examination of Welds and Acceptance Criteria
ASME Code Case 2235 Rev 9 ñ Use of Ultrasonic Examination in Lieu of Radiography
Non-Destructive Examination of Welded Joints ñ Ultrasonic Examination of Welded Joints. ñ British and European Standard BS EN 1714:1998
Non-Destructive Examination of Welds ñ Ultrasonic Examination ñ Characterization of Indications in Welds. ñ British and European Standard BS EN 1713:1998
Calibration and Setting-Up of the Ultrasonic Time of Flight Diffraction (TOFD) Technique for the Detection, Location and Sizing of Flaws. ñ British Standard BS 7706:1993
WI 00121377, Welding ñ Use Of Time-Of-Flight Diffraction Technique (TOFD) For Testing Of Welds. ñ European Committee for Standardization ñ Document # CEN/TC 121/SC 5/WG 2 N 146, issued Feb, 12, 2003
ASTM E 2373 ñ 04 ñ Standard Practice for Use of the Ultrasonic Time of Flight Diffraction (TOFD) Technique
Non-destructive testing of welds - Ultrasonic testing - Use of time-of-flight diffraction technique (TOFD). - International Standard EN ISO 10863:2011
Non-Destructive Testing ñ Ultrasonic Examination ñ Part 5: Characterization and Sizing of Discontinuities. ñ British and European Standard BS EN 583-5:2001
Non-Destructive Testing ñ Ultrasonic Examination ñ Part 2: Sensitivity and Range Setting. ñ British and European Standard BS EN 583-2:2001
AD 2000-Merkblatt HP 5/3 Anlage 1:2015-04: Zerstˆrungsfreie Pr¸fung der Schweiþverbindungen - Verfahrenstechnische Mindestanforderungen f¸r die zerstˆrungsfreien Pr¸fverfahren - Non-destructive
testing of welded joints ñ Minimum technical procedure requirements for non-destructive testing methods (Germany)
The zero point test and annual verification procedures of ISONIC 2006 are fully compliant with the international standards below and the corresponding national norms
EN 12668-1 / ISO 22232-1. Non-destructive testing ñ Characterization and verification of ultrasonic examination equipment. Part 1: Instruments
EN 12668-3 / ISO 22232-3. Non-destructive testing ñ Characterization and verification of ultrasonic examination equipment. Part 3: Combined Equipment
Spike pulse - smoothly tunable (18 levels) 50V Ö 400 V into 50 Ω at 4 levels of excitation energy
Square wave pulse - smoothly tunable (18 levels) 50V Ö 400 V into 50 Ω
Pulse Duration:
Spike pulse - 10Ö70 ns for 50 Ω load depending on Energy and Damping setup
Square wave pulse - 65Ö600 ns controllable in 5 ns step with driving of both leading edge and trailing edge of the pulse
Energy (Spike Pulse):
4 discrete energy values / 40 μJ (min) to 250 μJ (max) ñ at 400V amplitude
Modes:
Single / Dual
Damping:
17 discrete resistances values / 25Ω min to 1000 Ω max
0...99 % of screen height controllable in 1% resolution
DAC / TCG:
Theoretical ñ through keying in dB/mm (dB/") factor
Experimental ñ through sequential recording echo amplitudes from variously located equal reflectors
46 dB Dynamic Range, Slope ≤ 20 dB/μs, Capacity ≤40 points
Available for Rectified and RF Display
DGS:
Standard Library for 18 probes / unlimitedly expandable
Gates:
2 Independent Gates / unlimitedly expandable
Gate Start and Width:
Controllable over whole variety of A-Scan Display Delay and A-Scan Range settings
in 0.1 mm /// 0.001" resolution
Gate Threshold:
5Ö95 % of A-Scan height controllable in 1 % resolution
Measuring Functions ñ Digital
Display Readout:
27 automatic functions / expandable; Dual Ultrasound Velocity Measurement Mode for
Multi-Layer Structures; Curved Surface / Thickness / Skip correction for angle beam probes; Ultrasound velocity and Probe Delay Auto-Calibration for all types of probes
Freeze (A-Scans and Spectrum Graphs)
Freeze All
Freeze Peak
All signal and spectrum evaluation functions, managing gates and Gain settings are allowed for frozen signals
Encoding:
Straight Line Scanning:
Time-based (built-in real time clock ñ 0.02 sec resolution)
True-to-location (incremental encoder ñ 0.5 mm resolution)
XY Scanning:
Airborne Ultrasound (see below)
Airborne Ultrasound Based Encoding Characteristics:
Area of probe manipulation
≤2000x3000 mm ≤80x120 "
≤500x500 mm ≤20x20 "
≤200x200 mm ≤8x8 "
Curvature radius of scanning surface
≥2000 mm / ≥40 "
≥200 mm / ≥8 "
≥37 mm / ≥1.5 "
Scanning Speed
≤150 mm/s ≤6 "/s
≤150 mm/s ≤6 "/s
≤150 mm/s ≤6 "/s
Scan Index
1 to 20 mm controllable in 1 mm step
1 to 20 mm controllable in 1 mm step
0.25 mm; 0.5 mm or 1 to 20 mm controllable in 1 mm step
Resolution for determining of probe coordinates
≥1 mm / ≥0.04 "
≥1 mm / ≥0.04 "
≥0.25 mm / ≥0.01 "
Resolution for determining of probe swiveling angle
-
1°
0.5°
Range of probe swiveling
-
±90°
±90°
Immunity to ambient noise
≤60 dB
≤60 dB
≤60 dB
Coupling Monitor:
Built-in controller and interface for Coupling Monitor suitable for any kind of ultrasonic probe at scanning speed up to 150 mm /sec (6 in /sec); resolution ñ 0.5 dB
Testing Integrity Monitoring:
Background imaging of Scanning Plan
Recording and imaging of Actual Probe Trace
Generating perceptible marks corresponding to current coupling degree, probe position, and swiveling angle whilst scanning
Interrupting recording and imaging of actual probe trace if missing coupling and/or probe position and/or swiveling angle
Imaging Modes:
Thickness Profile B-Scan, Cross-sectional B-Scan, Plane View CB-Scan, C-Scan, D-Scan, P-Scan, TOFD ñ depending on mode of operation selected accompanied with corresponding instrument settings
Imaging Characteristics:
Inspection
Angle Beam
Staright Beam
Width of Volume under test
5 to 300 mm controllable in 1 mm resolution ñ expandable
0.2 to 12 " controllable in 0.01 " resolution - expandable
50 to 2000 mm controllable in 1 mm resolution ñ expandable
0.2 to 80 " controllable in 0.01 " resolution ñ expandable
Thickness of Volume under test
5 to 300 mm controllable in 1 mm resolution ñ expandable
0.2 to 12 " controllable in 0.01 " resolution - expandable
0.5 to 300 mm controllable in 0.1 mm resolution ñ expandable
0.02 to 12 " controllable in 0.01 " resolution - expandable
Image Resolution
0.5 mm x 0.5 mm x Half Scan Index
0.02 in x 0.02 in x Half Scan Index
0.2 mm x 0.5 mm x Half Scan Index x
0.01 in x 0.02 in x Half Scan Index
Standard Color Scale (Palette)
Pseudo Color
Gray
Thermal
Pseudo Color
Gray
Thermal
User Defined Color Scales (Palettes)
≤232 colors
≤232 colors
Signal Amplitude Coloring Protocol
Linear
TCG Normalizing
DAC Normalizing
DGS Normalizing
Customized
Linear
TCG Normalizing
DAC Normalizing
Customized
Length of one Straight Line Scanning record:
50Ö20000 mm (2"Ö800"), automatic scrolling
Method of Record:
Complete raw data recording
Region of Interest:
Controllable over entire Display Delay, Probe Delay, Range, US Velocity and other appropriate
instrument settings
Off-Line Image Analysis:
Recovery and play back of A-Scan captured during scanning
Echo-dynamic pattern analysis
Defects sizing and outlining
Statistical analysis of Thickness / Amplitude data
Converting Record into ASCII/MS Excel®/MS Word® formats
At least 100000 sets including calibration dumps accompanied with A-Scans and/or Spectrum Graphs
At least 10000 sets including calibration dumps accompanied with Thickness Profile B-Scans, cross-sectional B-Scans, plane view CB-Scans, TOFD maps, CB-Scans, C-Scans, D-Scans, P-Scans, or TOFD Maps and complete sequence of A-Scans captured during scanning
Data Logger:
Optional ñ creates and manages database files capable to store up to 254745 records each and organized as 2D matrix; in database every record includes thickness reading accompanied with corresponding raw data A-Scan and instrument setup
On-Board Computer
AMD LX 800 - 500MHz
RAM:
512 Megabytes
Flash Memory - Quasi HDD
4 Gigabytes
Outputs:
LAN, USB X 2, PS 2, SVGA
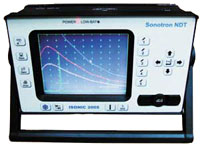
Screen:
6.5" High Color Resolution (32 bit) SVGA 640×480 pixels 133×98 mm (5.24" ×3.86") Sun-readable
LCD; Maximal A-Scan Size (working area) ñ 130×92 mm (5.12" × 3.62")
Controls:
Front Panel Sealed Keyboard, Front Panel Sealed Mouse, Touch Screen
Compatibility with the external devices:
PS 2 Keyboard and Mouse, USB Keyboard and Mouse, USB Flash Memory card, Printer
through USB or LAN, PC through USB or LAN, SVGA External Monitor
Operating System:
Windows™ XP Embedded
Power:
Mains - 100Ö240 VAC, 40Ö70 Hz, auto-switch; Battery 12V 8AH up to 6 hours continuous operation
Housing:
IP 53 rugged aluminum case with carrying handle
Dimensions:
265×156×121 mm (10.43"×6.14"×4.76") - without battery
265×156×159 mm (10.43"×6.14"×6.26") - with battery
Weight:
3.150 kg (6.93 lbs) - without battery
4.280 kg (9.42 lbs) - with battery
Conventional pulse echo and through transmission A-Scan-based inspection
640X480 pixels A-Scan display of the working area with physical dimensions 130 x 90 mm (5.12" x 3.62") is among the largest for the plurality of portable ultrasonic flaw detectors
Combined adjustable spike / square wave pulser equipped with the variety of probe impedance matching coils allows providing of the best ultrasonic wave penetration for various materials
characterized either by high or low grain size, sound attenuation, and the like
High frequency probe will not be destroyed occasionally upon connecting to instrument's firing output even if the duration of square wave initial pulse is improperly long thanks to the probe damage prevention circuit
automatically limiting the energy transmitted to the probe's crystal
46 dB dynamic range 20 dB/µs maximum slope multiple curve DAC/TCG may be created using up to 40 data points to correct the distance ñ amplitude variations of ultrasonic signals
The theoretical or experimental DAC may be created through keying in the dB/mm (dB/") factor or one-by-one recording of the echo amplitudes from the variously located reflectors
DAC/TCG may be applied to the rectified A-Scans (positive, negative, and full wave) and to the RF A-Scans as well
The built-in DGS database for the standard probes is unlimitedly expandable
Thanks to the extended dynamic range the signals significantly exceeding the A-Scan height (up to 199.9%) may be evaluated without Gain drop
Manipulating of the Gain and Gates settings is possible for the frozen A-Scans providing bringing of the stored signals to the level most convenient for the off-line evaluation
The Dual Ultrasound Velocity Measurement Mode extremely simplifies resolving of the sound path distances for the dissimilar materials adjacent to each other whereas the different values of ultrasound velocity are
valid for the variety of the signals appearing on the same A-Scan
The RF display mode combined with the frequency domain signal analysis (FFT) enhances the instrumentís capabilities for the ultrasonic spectroscopy with the purpose of materials characterization,
bond inspection, testing of dissimilar materials, defect pattern analysis, probes evaluation, etc
Optional data logger organizes and manages database files capable to store up to 254745 thickness readings each and organized as 2D matrix. In
the database every thickness reading is accompanied with the corresponding raw data A-Scan and instrument setup. Automatic creating of MS ExcelÆ thickness spreadsheet meets the
requirements of various Risk Based Inspection and Maintenance (RBIM) procedures
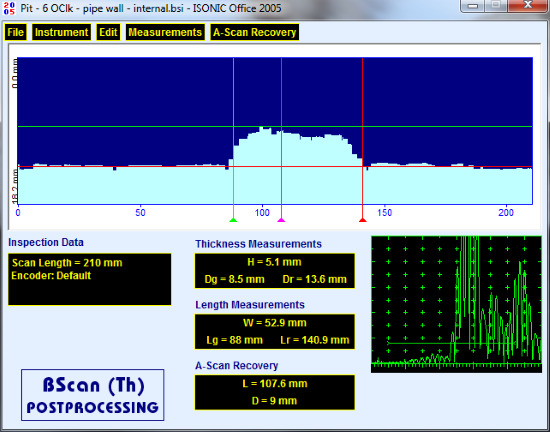
The Thickness Profile imaging and recording is performed in the same manner as in the ISONIC 2005 instrument through the continuous capturing of the thickness readings along the probe trace:
Both time-based (real time clock) and true-to-location (built-in incremental encoder interface) modes of data recording are supported
The complete sequence of A-Scans is recorded along with the thickness profile
The off-line evaluation of the thickness profile record is featured with:
Sizing of the thickness damages: the remaining thickness, the thickness loss, and the length of the damage
Play-back and evaluation of the A-Scans captured during the scanning
Off-line reconstruction of the thickness profile image for various Gain and/or Gate settings
Automatic conversion of the thickness profile B-Scan data into MS Excel® spreadsheet meeting the requirements of various Risk Based Inspection and Maintenance (RBIM) procedures
Typical Application: Corrosion characterization
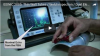
Movie for the Thickness Profile imaging principle:
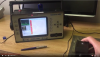
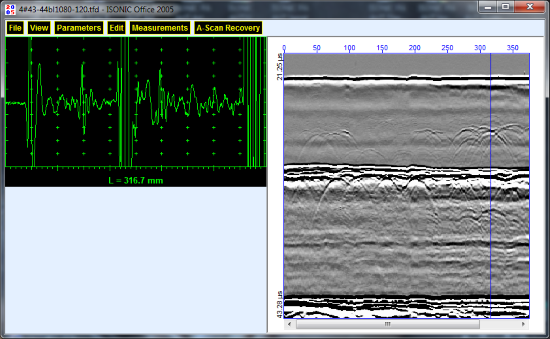
Typical Thickness B-Scan screen:
Thickness profiling with use of the automatic scanner:
Note: In order to accelerate the data stream the videos above are linked to the Youtube. In case the YouTube may not be accessed from your location please use the links below
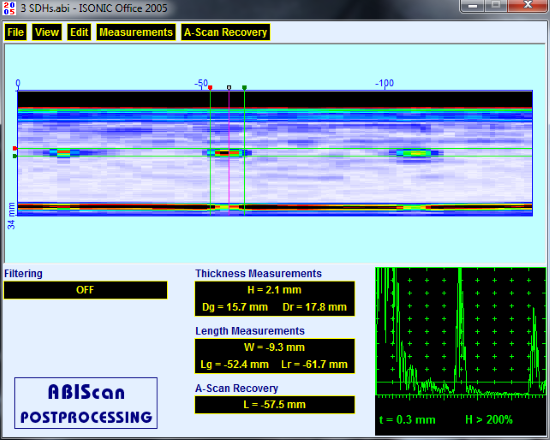
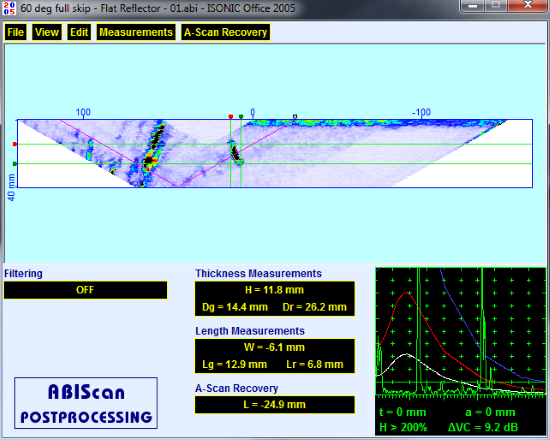
The B-Scan cross-sectional imaging and recording of defects for longitudinal and shear wave inspection is performed in the same manner as in the ISONIC 2005 instrument through the continuous measuring of the echo amplitudes and reflectors coordinates along the probe trace:
Both time-based (real time clock) and true-to-location (built-in incremental encoder interface) modes of data recording are supported
The complete sequence of A-Scans is recorded along with the B-Scan image
Off-line evaluation of the B-Scan record is featured with:
Sizing of the defects:the coordinates and projection dimensions
Play-back and evaluation of the A-Scans captured during the scanning
Defects outlining and the echo-dynamic pattern analysis
Reconstruction of the B-Scan image for the various Gain and/or Reject settings
DAC / DGS B-Scan image normalization
Typical Applications: Pulse echo inspection of welds, composites, metals, plastics, and the like
Movie for the B-Scan cross-sectional imaging principle:
Typical B-Scan screens for the 0-deg and angle beam inspection:
Note: In order to accelerate the data stream the video above is linked to the Youtube. In case the YouTube may not be accessed from your location please use the link below
The CB-Scan horizontal plane-view imaging and recording of the defects for shear, surface, and guided wave inspection is performed in the same manner as in the ISONIC 2005 instrument through the continuous measuring of the echo amplitudes and reflectors coordinates along the probe trace:
Both time-based (real time clock) and true-to-location (built-in incremental encoder interface) modes of data recording are supported
The complete sequence of A-Scans is recorded along with the CB-Scan image
Off-line evaluation of the CB-Scan record is featured with:
Sizing of the defects: the coordinates and projection dimensions
Play-back and evaluation of the A-Scans captured during the scanning
Defects outlining and the echo-dynamic pattern analysis
Reconstruction of CB-Scan image for the various Gain and/or Reject settings
DAC/DGS CB-Scan image normalization
Typical Applications: SRUT guided wave and CHIME inspection of the annular rings, plates, pipewalls, shells, and the like for the pitting, stress corrosion, etc; weld inspection, surface wave inspection
Movie for the CB-Scan horizontal plane-view imaging principle:
Typical CB-Scan screen for the SRUT guided wave inspection of the annular ring:
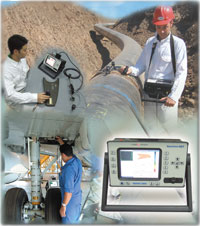
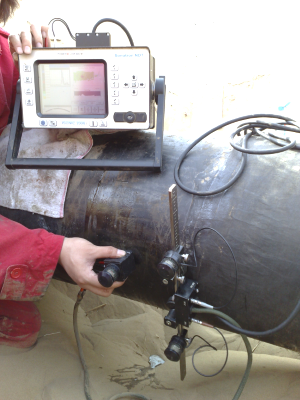
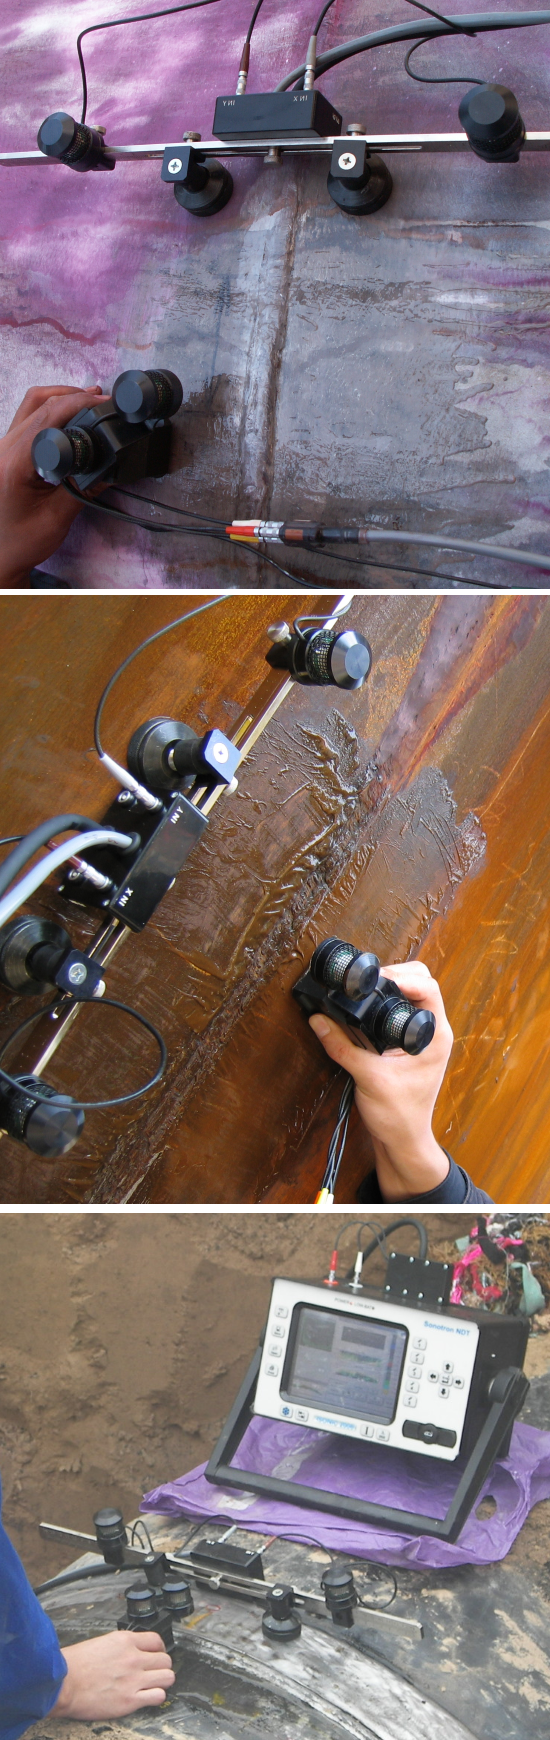
In the field:
Detecting Defects through the High Alloy Cladding with Irregular Surface using SRUT Probe:
CB-Scan Record for the Shear Wave Inspection of Welds in the Thin Wall Tubes with the use of
Dual Element Probes with Flexible Contact Face:
Note: In order to accelerate the data stream the videos above are linked to the Youtube. In case the YouTube may not be accessed from your location please use the links below
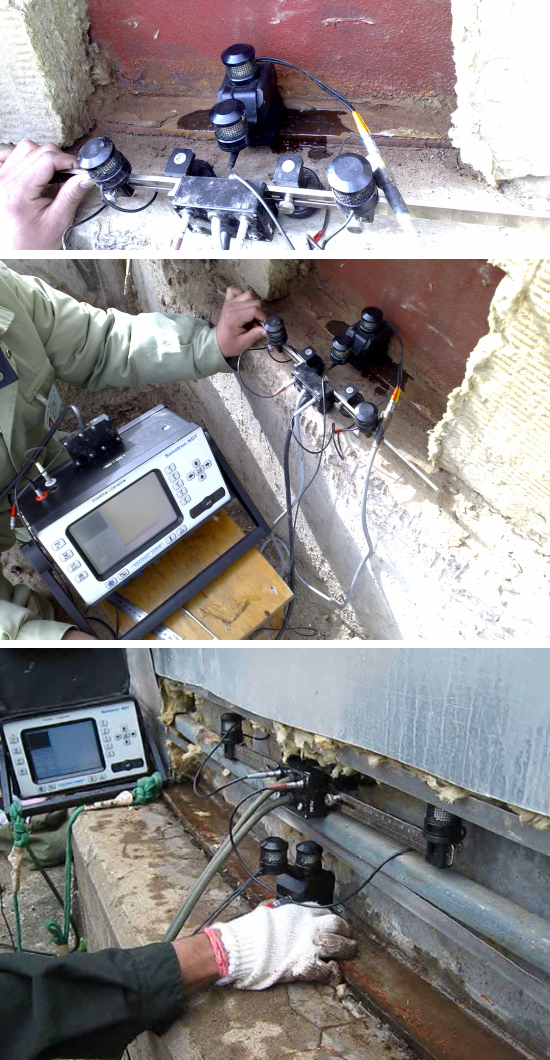
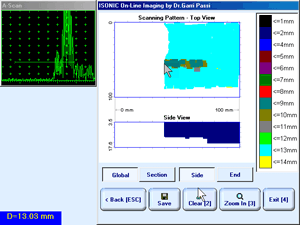
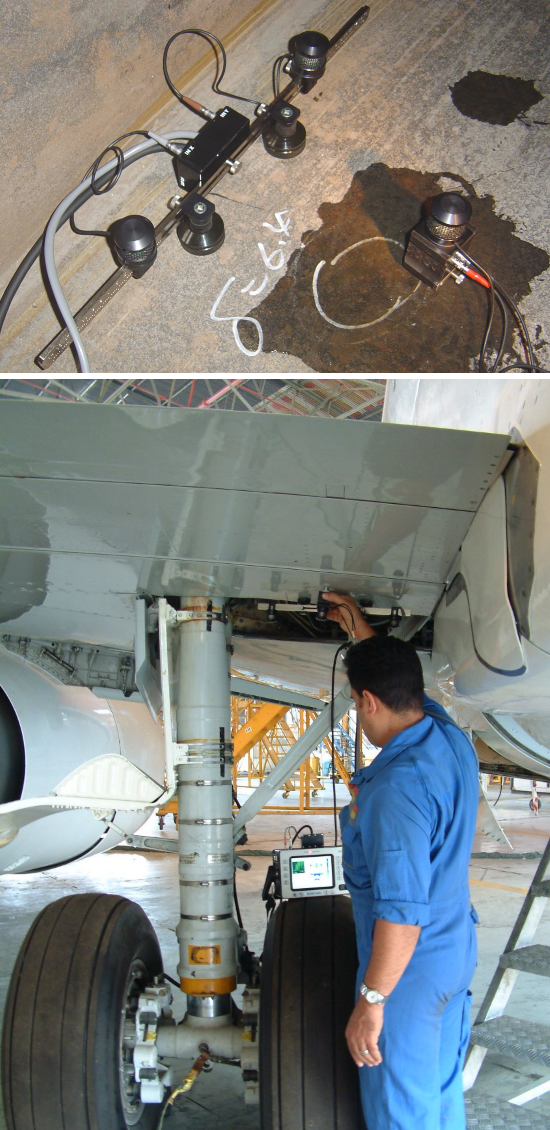
The mechanics-free true-to-location CB-Scan horizontal plane-view imaging of the large areas is performed through the manual scanning over the narrow strip on the surface of the material with
continuous measuring and recording of echo amplitudes and reflectors coordinates along with the probeís XY-position and swiveling angle:
True-to-location data recording is provided with the use of the mechanics-free airborne ultrasound encoding; for that purpose the airborne ultrasound emitter either single or dual is fitted
onto the top of the probe performing the inspection while the receivers of airborne ultrasound are placed onto the part under test or at some proximity to it by means of either magnetic legs
or vacuum cups (comparing to the single emitter of airborne ultrasound the dual emitter allows detection of probe swiveling angle in addition to XY-coordinates); the operator grips the said
probe and performs the scanning manually
The complete sequence of A-Scans is recorded along with the real time CB-Scan imaging
The off-line evaluation of captured CB-Scan Images and A-Scans is featured with:
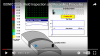
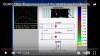
On-Line Instrument Screenshot
Off-Line Instrument Screenshot
Sizing of the defects: the coordinates, XY projection dimensions, and the area covered
Play-back and evaluation of the A-Scans obtained during scanning; echo-dynamic pattern analysis
CB-Scan image reconstruction for the various Gain and/or Reject settings
Typical Application:
Flaw detection and corrosion screening using guided and surface waves; defect outlining with use of shear / longitudinal wave angle beam probes
Movie illustrating the principles of CB-Scan recording and imaging with use of mechanics-free airborne ultrasound encoding means:
Move for the SRUT guided wave inspection of the annular ring with use of the mechanics-free airborne ultrasound encoder:
Note: In order to accelerate the data stream the videos above are linked to the Youtube. In case the YouTube may not be accessed from your location please use the links below
TOFD Inspection ñ RF B-Scan and D-Scan Imaging is performed in the same manner as in the ISONIC 2005 instrument
Both time-based (real time clock) and true-to-location (built-in incremental encoder interface or airborne ultrasound encoder) modes of data recording are supported
Averaging A-Scans whilst recording as per operator's selection
The complete sequence of RF A-Scans is recorded along with the TOFD map
Off-line evaluation of the TOFD Map - the all-functional TOFD postrpocessing is featured with:
Improvement of the near surface resolution through the removal of lateral wave and/or back echo record
Linearization and straightening
Play-back and evaluation of the A-Scans obtained during the scanning
Manipulating the contrast of the TOFD image through varying Gain setting, ADC grades, and/or rectification
Defects pattern analysis and sizing:
Depth and Height
Position along the fusion line and Length: parabolic cursors and SAFT are applicable
The video below illustrates TOFD A-Scan for the sharp edged planar vertical and compact discontinuities:
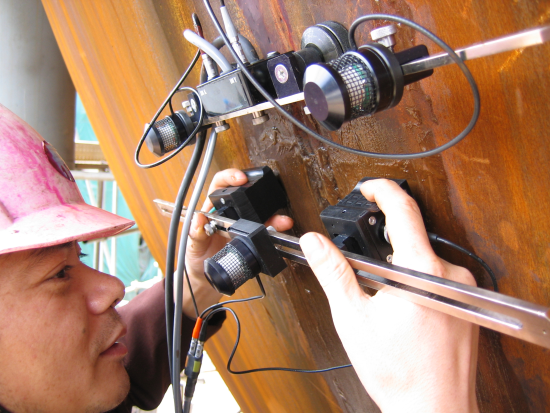
Note: Airborne ultrasound encoding allows mechanics-free true-to-location recording of the TOFD data. For that purpose the fixture carrying a pair of TOFD probes is equipped with the emitter
of airborne ultrasound and the recievers of airborne ultrasound are placed onto the part under test with use of magnetic legs or vacuum cups providing the continous monitoring of the TOFD probes position
and the data capturing
Movie for the TOFD Recording and Imaging principle (the video was captured on the specimen made of HDPE):
Typical TOFD record for the weld inspection:
In the field:
Note: In order to accelerate the data stream the videos above are linked to the Youtube. In case the YouTube may not be accessed from your location please use the links below
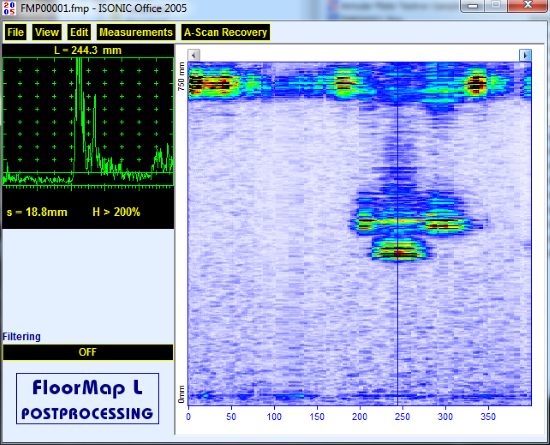
The mechanics-free true-to-location C-Scan Corrosion (Thickness) Mapping is performed through the manual raster scanning (XY) over the planar and curved
surfaces with continuous measuring and recording of the wall thickness readings along with the corresponding probe positions and raw A-Scans
True-to-location data recording is provided through the raster scanning (XY-scanning) over the planar and curved surfaces with use of the mechanics-free airborne ultrasound encoding;
for that purpose the airborne ultrasound emitter and the probe performing the inspection are fitted together into the appropriate holder while the receivers of airborne ultrasound
are placed onto the part under test or at some proximity to it by means of either magnetic legs or vacuum cups ñ the operator grips the said probe holder and performs the raster
scanning manually
The complete sequence of A-Scans is recorded and the rendering and mapping of the back wall surface is performed in real time (on the fly)
The off-line evaluation means of the captured XY- wall thickness and A-Scan distribution data are featured with:
Sizing of thickness damages with finding of the:
remaining thickness / thickness loss
XY-dimensions and area occupied by the damage
statistical distribution of the remaining thickness / thickness loss over the damaged area
Play-back and evaluation of the A-Scans obtained during scanning; echo-dynamic pattern analysis
Back wall surface profile / thickness map reconstruction for various Gain and/or Gate settings
Converting of the XY- wall thickness distribution data into MS Excel® spreadsheet and other formats compatible with various Risk Based Inspection and Maintenance (RBIM) procedures
Typical Application:
Corrosion detection and characterization
The movies below illustrate the principles of corrosion mapping, its implementation, and posptprocessing of the scanning results in the PC:
Note: In order to accelerate the data stream the videos above are linked to the Youtube. In case the YouTube may not be accessed from your location please use the links below
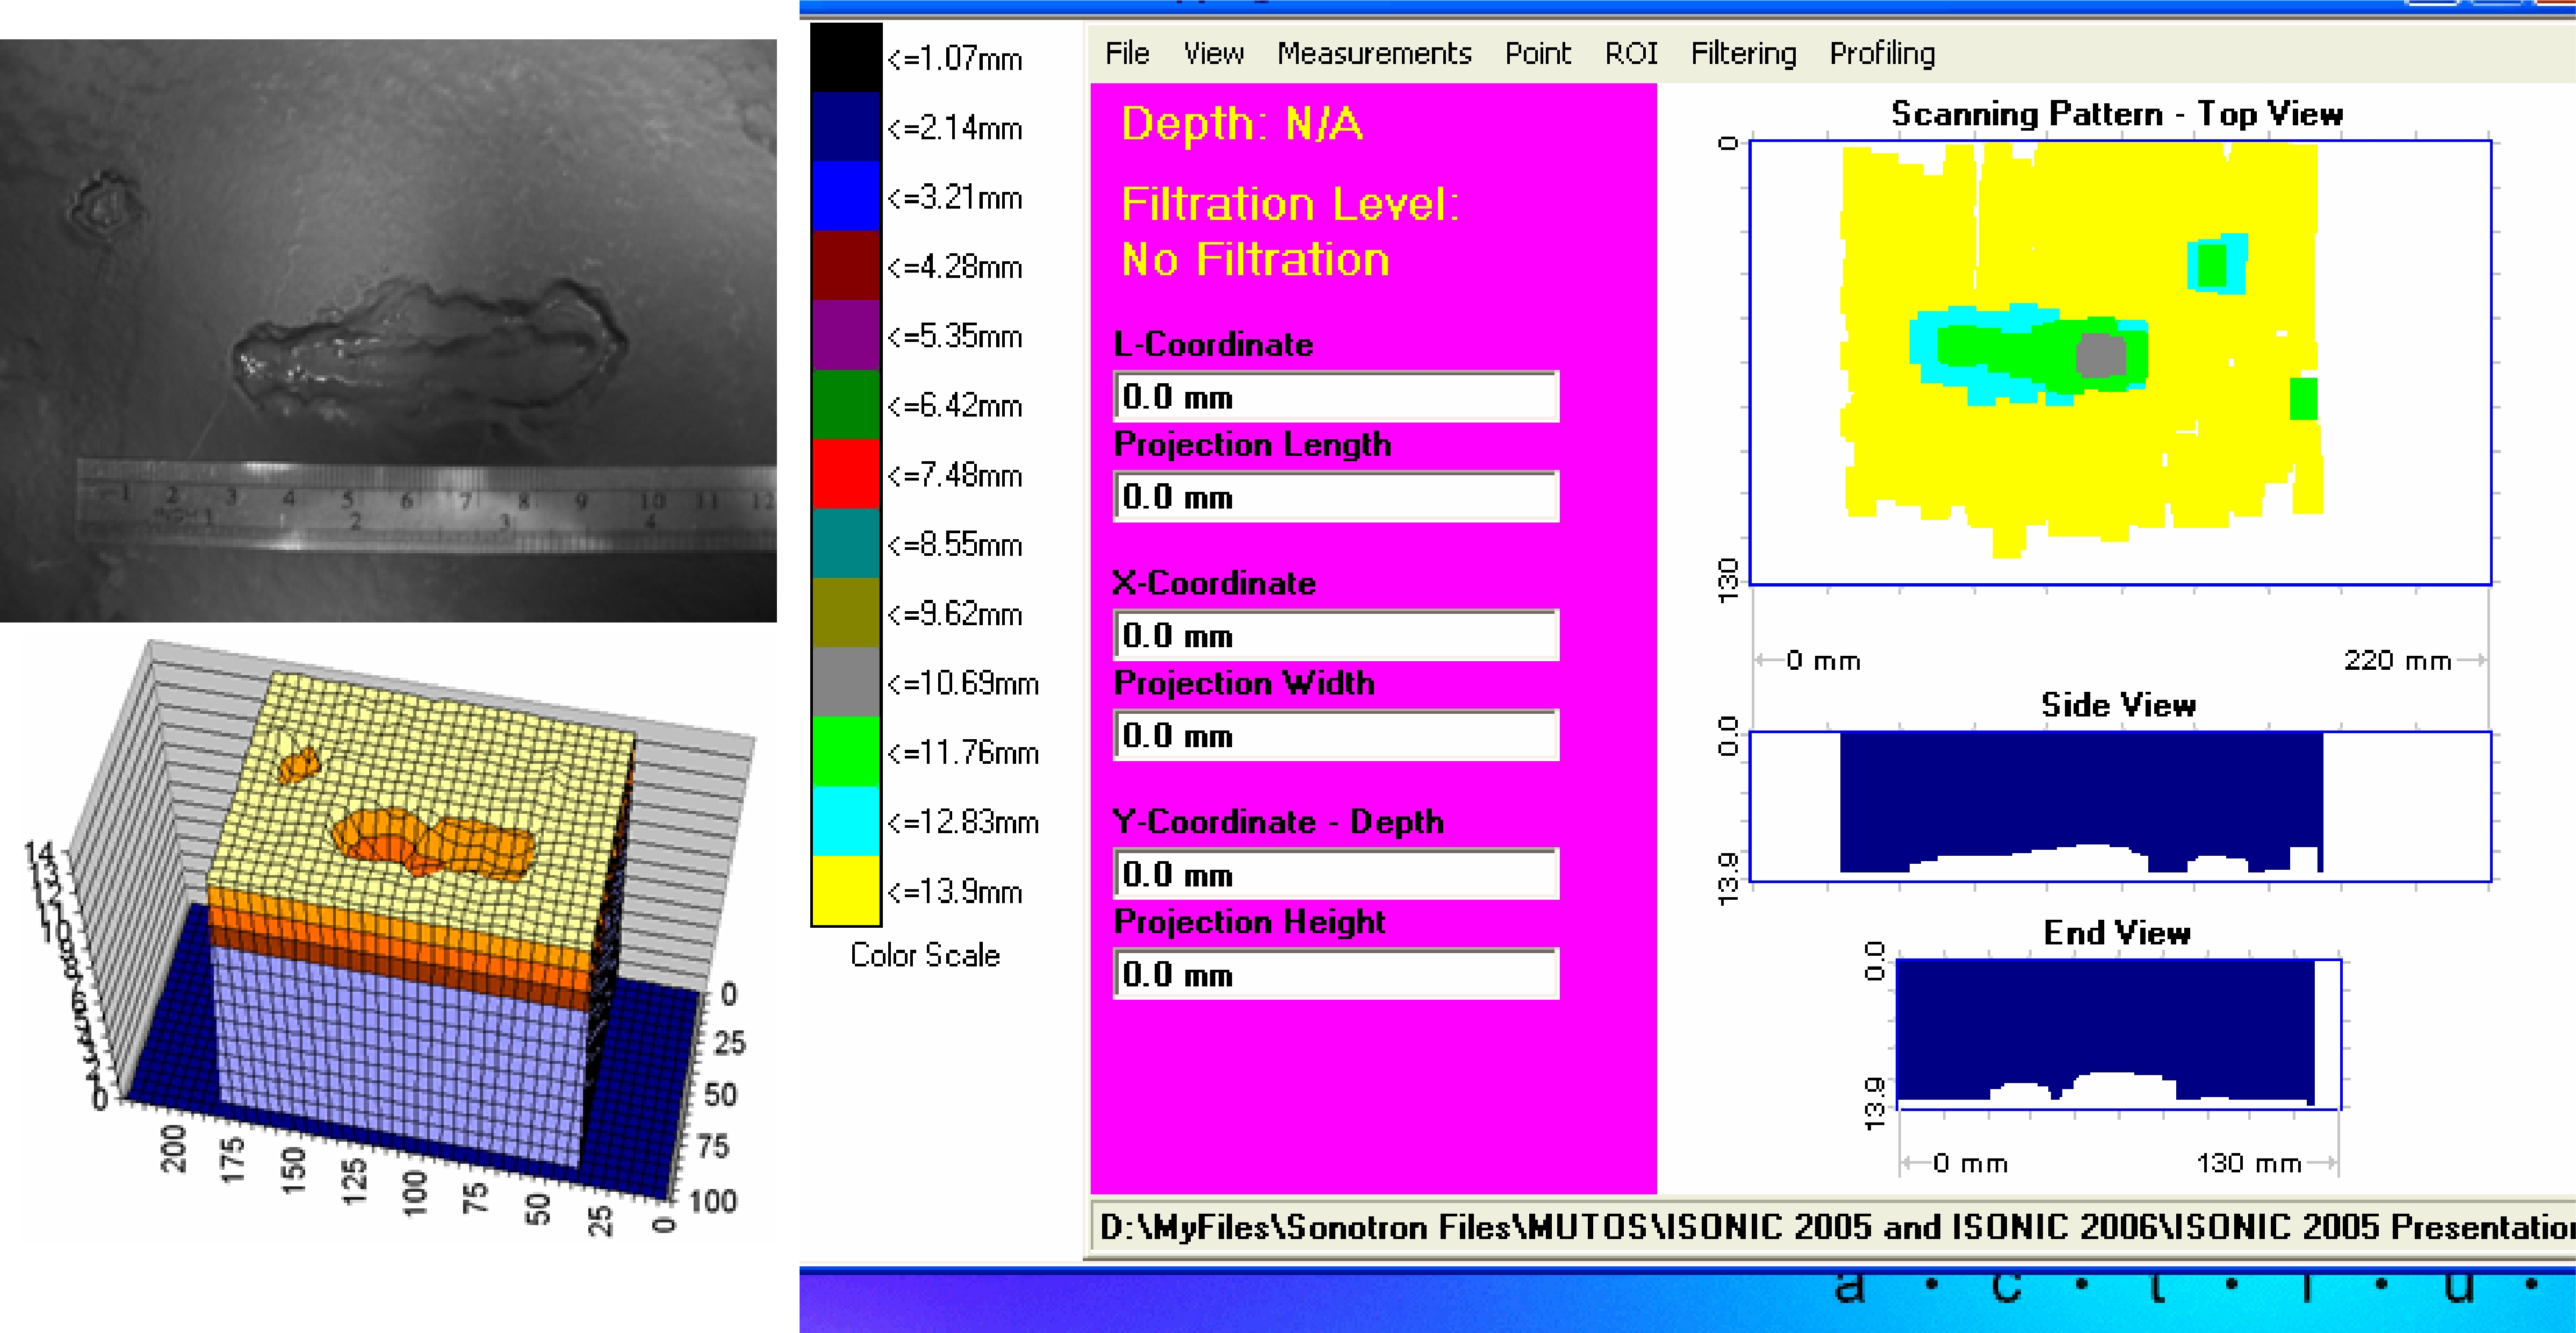
The mechanics-free true-to-location straight beam inspection with 3D data presentation (B-, C-, and D-Scan) is performed through the manual raster scanning (XY) over the planar and curved surfaces
with continuous measuring and recording of the echo amplitudes and reflectors coordinates along with the corresponding probe positions and raw A-Scans
True-to-location data recording is provided through the raster scanning (XY-scanning) over the planar and curved surfaces with use of the mechanics-free airborne ultrasound encoding;
for that purpose the airborne ultrasound emitter and the probe performing the inspection are fitted together into the appropriate holder while the receivers of airborne ultrasound are placed
onto the part under test or at some proximity to it by means of either magnetic legs or vacuum cups ñ the operator grips the said probe holder and performs the raster scanning manually
The complete sequence of A-Scans is recorded and the B-, C-, and D-Scan imaging is performed in real time (on the fly)
The off-line evaluation means of the captured B-, C-, and D-Scan images and A-Scan distribution data is featured with:
Sizing of defects with finding of the:
maximal echo amplitude
depth
XY projection dimensions and area occupied by the defect
statistical distribution of the echo amplitudes and depth
Play-back and evaluation of the A-Scans obtained during the scanning; echo-dynamic pattern analysis
B-, C-, and D-Scan image reconstruction for various Gain and/or Gate and/or Reject settings
Slicing of the C- and D-Scan images
Converting of the B-, C-, and D-Scan data into MS ExcelÆ spreadsheet and other formats compatible with various Risk Based Inspection and Maintenance (RBIM) procedures
Typical Applications:
Compression wave flaw detection of various materials (CFRP, GFRP, ceramics metals, etc) and parts made of them at various stages (study, design, manufacturing, service) for the manufacturing defects and in-service obtained damages
The movies below illustrate the principles of mechanics-free C-scan flaw detection, its implementation, and postprocessing in the office PC:
Note: In order to accelerate the data stream the videos above are linked to the Youtube. In case the YouTube may not be accessed from your location please use the links below
The mechanics-free true-to-location angle beam inspection with 3D data presentation (P-, D-, and B-Scan) is performed through the manual raster scanning (XY) over the planar and curved surfaces of the
areas of parent material adjacent to the weld with continuous measuring and recording of echo amplitudes and reflectors coordinates along with the corresponding probe positions, swiveling angles,
and the raw A-Scans:
True-to-location data recording is provided with the use of the mechanics-free airborne ultrasound encoding; for that purpose the airborne ultrasound emitter either single or dual and the
probe performing the inspection are fitted together into the appropriate holder while the receivers of airborne ultrasound are placed onto the part under test or at some proximity to it by means of
either magnetic legs or vacuum cups ñ the operator grips the said probe holder and performs the raster scanning manually from one or both sides of the weld
The complete sequence of A-Scans is recorded and the P-, D-, and B-Scan imaging is performed in real time (on the fly)
The off-line evaluation means of the captured P-, D-, and B-Scan images and A-Scan distribution data is featured with:
Sizing of defects with finding of the:
maximal echo amplitude
depth and projection height
horizontal plane projection position across the weld and projection width
position along the fusion line and projection length
Play-back and evaluation of the A-Scans obtained during scanning; echo-dynamic pattern analysis
P-, D-, and B-Scan image reconstruction for various Gain and/or Reject settings
Slicing of the P-Scan and D-Scan images
Typical Application:
Weld and base metal angle beam inspection
The movies below illustrate the principles of mechanics-free angle beam flaw detection and recording for welds and its implementation:
Note: In order to accelerate the data stream the videos above are linked to the Youtube. In case the YouTube may not be accessed from your location please use the links below